Tag Archives: itsdemtitans

Chemostratigraphy shows the geologic column is no flood deposit

The one thing that bugs me about creationism is they rarely put forth any real research (and what they do make is usually revealed to be crap based on shoddy data). They love to point out anomalies such as soft tissue remnants in fossils and claim that it’s flat out impossible for it to be there if the fossils are ancient. There’s no good reason to think this, as the processes which form the rock are far better established than long term tissue decay rates in dinosaur fossils.

But what I consistently notice is they’ll use things like soft tissue to try and advocate their position must be right by default. I mean, how else would you explain these discoveries???

I don’t know. Scientists are only just beginning to find out what mechanisms may play a role in preserving tissue remnants over long periods of time. But what needs to be made absolutely clear, and that creationists just can’t seem to get, is that even if we don’t know how these anomalies came to be, that does not prove their global flood at all. The simple fact is their global flood idea has been falsified over and over, and over, and over again. A falsified model, which I will show as conclusively falsified below, is not the answer.

Now then, how do we know, conclusively, that a global flood as advocated by YECs never happened? It’s all due to this lovely branch of geology known as Chemostratigraphy.

Chemostratigraphy is the study of the chemical variations within sedimentary sequences to determine stratigraphic relationships.(1.) This obscure subdiscipline in geology completely undermined every young-Earth interpretation of the geologic column. Before reading any further, I’d highly advise reading the crash course on chemostratigraphy at AgeofRocks.

To sum it up, Chemostratigraphers can use the ratios of certain stable isotopes, such as Carbon 12 or 13, to determine the chemical make ups of rocks and graph them stratigraphically. Often this is because the isotope ratios will record certain events from the time periods when the rocks were laid down, such as the carbon levels in the ocean.

Here’s the analogy from AgeofRocks:

Perhaps the best way to illustrate isotopes of carbon in the ocean is with a bowl of red and green M&M’s, where each color corresponds to a different stable isotope of carbon. For the sake of discussion, this bowl contains precisely 50% green M&M’s (light carbon) and 50% red M&M’s (heavy carbon), for a ratio of 1:1. Now, imagine you leave the room and return later to find that the ratio has shifted to 0.9:1.1, meaning the bowl has been enriched in red M&M’s. There are two possibilities that could explain the shift: either someone added a sample containing more than 50% red M&M’s, or someone removed a sample containing less than 50% red M&M’s. Perhaps you have a child, therefore, who prefers one color to the other, so every handful he takes is biased to that color. This process will leave the bowl preferentially enriched in the other color. If every handful contained precisely half green and half red M&M’s, then the ratio of green to red in the bowl would never change. Likewise, any process that removes carbon from the ocean will change the δ13C value of oceanic carbon, so long as the isotopic ratio of the sample differs from that in the bulk ocean.

Typically, we can use index fossils and radiometric dating alongside stratigraphy to determine that, for example, a rock layer in Nevada is the same age as a rock layer in southern China (perhaps they both contain a unique assemblage of Cambrian-aged trilobites). According to a flood geologist, these layers were deposited in a single year around 5000 years ago. However, they were not necessarily deposited [i]simultaneously[/i]. So, if the fossils are in the same order, it has to be due to hydrological sorting or ecological zonation. Regardless of how the order arose, one thing is certain: if these marine organisms were all buried in a global flood, then all of them made their shells from the [i]same ocean and the same reservoir of carbon with approximately the same isotopic ratio.[/i] So when fossilized shells of trilobites, brachiopods, mollusks, etc. are analyzed across the Phanerozoic (542 Ma – Present) for carbon isotopes, flood geology would predict that the levels of carbon found in all of these animals, regardless of where in the column, should have an equal amount of the same isotopes.

But this is not what we see. (3.) Instead, what we see are patterns of fluctuating isotopes. This is best illustrated by the graph from Veizer et al.,

https://ageofrocks.files.wordpress.com/2014/08/eac8d-veizer1999.jpg?w=500&h=307

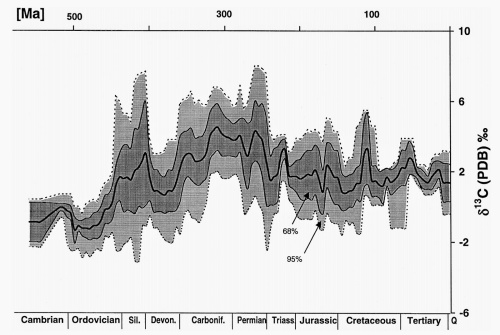
The graph shows that the carbon-isotope ratio in carbonate fossils—and therefore the ocean itself—varied substantially over the past 500 million years. This is in direct conflict with what one would expect had these fossils all been laid down by a single flood. Because the carbon reservoir in the ocean is so large (today, about 39,000 billion tons of carbon), the color of this bowl of M&M’s does not change appreciably on a whim—certainly not in the space of a 370 days. It takes time. Thus, chemostratigraphy leaves the creationist idea of a global flood dead in the water.

To be through, I’ll use the possible immediate objections to chemostratigraphy here, with refutations:

The flood caused wild variation in carbon isotopes!

Variations in the carbon-isotope ratios of fossils are far too great to be explained by shifting ocean chemistry within a single year, meaning these organisms could not have lived in the same ocean at the same time. See the attached graphic above. There would also need to be a mechanism for the addition and removal of massive amounts of carbon isotopes (2.), making the idea even less likely.

What’s more, the pattern of carbon-isotope variations from Cambrian to Quaternary is the same across the entire globe. Whether you’re sampling rocks from Texas or Tanzania, layers of limestone determined to be the same age according to their fossil content also exhibit the same pattern of δ13C values over time. These values are invariably high for Permian-aged carbonates and invariably low for Ordovician-aged carbonates.Consider the fact that in order to increase the oceanic δ13C value by only 5‰ requires a sustained doubling in the rate of organic carbon burial for about 1 million years. There is no reason for any proposed fluctuations in the flood to have been spread out evenly across these deposits all over the globe, especially not if all the sediment (and any carbon by extension) was getting mixed up prior to deposition. The values should be highly variable, not identical across the globe.

The animals in these areas prior to the flood lived in unique basins with different carbon ratios. Therefore, seeing their values varied like this should be expected.

If variations between one part of the ocean and another could account for trends in carbon isotopes, then we shouldn’t find the same temporal trends in different parts of the world (e.g. China vs. North America vs. Australia). Also, we find carbon isotope values changing significantly within the lifetime of single species (e.g. of Cambrian trilobites (4.) ), so one couldn’t claim that all those trilobites just lived in a unique basin prior to the flood. In every environment, the relative change in carbon isotopes correlates well from one site to the next. Finally, we can examine both carbon and strontium isotope trends to ensure that carbon variations weren’t limited to a unique environment (strontium isotopes don’t vary from one basin to the next). (2.)

Chemostratigraphy provides the final falsification of a global flood depositing all of the geologic column. It instead provided a wonderful opportunity to examine the chemical environment of Earth’s past and is a testament to an ancient world.

References:

1.https://en.wikipedia.org/wiki/Chemostratigraphy

2.http://ageofrocks.org/2014/08/23/chemostratigraphy-silent-objector-to-flood-geology/

3.http://www.sciencedirect.com/science/article/pii/S0009254199000819

4.http://ageofrocks.org/2014/08/27/the-spice-event-global-disruption-in-the-late-cambrian-carbon-cycle/

Refuting the “Highly expressed” gene argument against Chromosome 2 fusion

A common objection by creationists when presented with the fusion of Chromosome 2 in humans is that the fusion point contains a “highly expressed” gene, known as the DDX11L2. Does this refute the fusion model of Chromosome 2?

No, and while other objections to the fusion event exist, this blog post will specifically cover the DDX11L2 claim.

So, what is the DDX11L2? Surprisingly, and contrary to creationist claims, it is not a gene at all. It belongs to a family of pseudogenes, known as the DDX11L. The interesting thing about the DDX11L family is that they are a telomere specific gene family. Every single one in the human, chimp, and gorilla genome is found parked right next to a telomere. (1.) There is a single exception, the DDX11L2, parked right in the middle, surrounded by other telomere specific sequences. This is a fact that should be a red flag to any creationist, but for some reason they don’t seem to be phased by it.

I contacted geneticist David E. Levin to figure out why this family of pseudogenes are thought of as pseuodogenes.

“All members of the DDX11L family found at telomeric sites are regarded as pseudogenes derived from a functional gene initially named CHLR1, which encodes a DNA/RNA helicase. They are called pseudogenes because they only possess a few of the 26 exons of the functional CHLR1 gene. Thus, most of the gene is missing except for a chunk near the 3’ end. The CHLR1 sequence that is retained in the propagated DDX11L pseudogenes (about 3.5kb out of 25kb) shares 97.5%–98.5% nucleotide identity with the functional CHLR1 gene, supporting the notion that they are all derived from the one functional gene. Thus, they do not appear to code for anything and there is no evidence that the remaining short open reading frames are expressed even as small proteins.”

An enlightening response to say the least.

Considering the fact, as Dr. Levin has pointed out, that these pseudogenes only contain small exons that make up only a fraction of the exons found in the gene they derive from and as such do not seem to code for anything, why is it creationists claim this gene is functional?

This claim comes from Creationist Jeffrey Tomkins. He lays great emphasis on the fact that transcription factor binding has been found throughout the region. But simple binding says nothing about the specificity of binding or how important it is biologically. (2.) Therefore, there is no real reason to consider this gene functional.

However, there are more problems with the claims about the DDX11L2 made by creationists. For one, the vast majority of the recorded transcripts of the pseudogene don’t even span the fusion site! Take a look here at the compact gene diagram:

http://www.ncbi.nlm.nih.gov/IEB/Research/Acembly/av.cgi?db=human&c=Gene&l=DDX11L2

(Hover your mouse over the introns to see the figures)

The fusion site lies within the first intron of detected transcripts B and E, which is the green part. The only thing that seems to differentiate B and E is the slightly different length of the second intron.

If you click on b it shows that it has been detected once in bone marrow.

There have only been two detections of transcript E that actually include the exon on the far side of the fusion site, and they were both found in prostate tissue. The other four detections don’t actually span the fusion site. I’ll discuss the variants that DO cross into the fusion site a little later.

So, even within the detected variants of E alone, the majority does not include the fusion point as one of its introns. The claim this pseudogene always spans the fusion point is becoming a lot less convincing. To get an actual figure on roughly how many variants actually cross the fusion point, we’ll need to do a little math.

Hovering your mouse over the green exon will give you the number of RNA-seq reads. For the green intron, it was sequenced a total of 687 times. The Main intron, however, was sequenced a total of 3200 times. Division gives us approximately 4.7, which can be rounded up to 5. So, roughly, it can be calculated only around 20% of the recorded transcripts actually cross into the fusion point. The vast majority do not.

Now, let’s take a look at the green exon for a moment:

http://genome.ucsc.edu/cgi-bin/hgTracks?db=hg38&position=chr2%3A113601185-113605008&hgsid=445505293_kpxd9k8D5aVBMlVa0T2inHR8dkE1

(Once again, hover your mouse over the colored bits to get the data)

The exon lies within a piece of satellite DNA labelled “Repeat TAR1, family telo”.

If you run a BLAT search for this satellite sequence, you will find that it is a pretelomeric sequence (TAR stands for Telomere Associated Repeat) with nearly identical sequences found on the ends of chromosomes 1, 2, 4, 8, 10, 13, 19 (both ends), 21 and 22.

I’ll humor the creationists for a second. If this was in fact a functional transcript that has always required this exon, it would seem to be quite the coincidence that this exon is in fact part of a larger sequence that, save this one exception, has nearly identical sequences found on the ends of chromosomes.

Yet this still totally isn’t a telomeric remnant. Sure, uh huh, whatever it takes to deny the obvious.

Now let’s move back to transcript variants that do cross over the fusion site. How did they come to be?

First, one must establish whether or not these transcripts arose after the fusion event or during it. Again, we’ll turn to David Levin.(2.)

“If there was recognizable DDX-like sequence on either side of the repeats, this would give the appearance that the gene was there prior to the telomeric sequences. I did a BLAST search of this region some time ago and did not identify any other DDX-related sequences on the far side of the telomeric repeats, supporting the conclusion that the fusion predates the transcript. Moreover, the DDX-like genes all have a similar size, structure and sequences across their exons, as shown Costa et al., 2009, the paper that describes the DDX11L gene. This reveals that the entirety of the recognizable DDX-like sequence resides on one side of the fusion site. Finally, the Costa paper concludes that the family of DDX-like pseudogenes was propagated to many sub-telomeric locations, lending further support to the conclusion that this region was previously a telomere.”

(Emphasis added)

Also, when it was brought to his attention that the green exon lays within a telomere specific signature, he said,

“The most reasonable inference from all of this is that the transcript that reads through the fusion site either represents a new transcription start site, or an old one that was associated with a gene that was truncated by the fusion event, thus producing a chimeric transcript.”

I emailed him to get an explanation of what exactly a new transcription start site meant. Basically, there are areas of the DNA known as transcription factor recognition sequences, or start sites. These are typically six base pairs in length and appear randomly in 1 out of every 4000 base pairs. However, other segments that only differ by a single base pair exist every 200 base pairs. Thus, through mutation of one of these potential start sites, it is easily possible for a new transcription start site to emerge. This could, in essence, essentially be moved over. This easily accounts for why a fraction of the variants cross over the fusion point while most do not.

Back in the compact gene diagram, transcript B is a great example. It looks a lot like it’s been simply moved aside.

Now creationists might try and object to new start sites being able to move genes. But it’s a simple fact it can be done In fact; start sites brought forth by mutation are required in all the transcripts of DDX11L2. Why? Simply, the DDX11L pseudogene family is expressed as RNA, despite the fact that the entire front end of the normal gene (including the promoter and transcription start site) is missing. Therefore, even the shorter transcripts for DDX11L genes must have resulted from mutations to create new start sites.

So, there is a well-known mechanism to account for the few transcripts that cross the fusion point, and these factors also explain the general rule that most transcripts of the DDX11L2 do NOT include the fusion point.

Now overall, what does this the entirety of the presence of the DDX11L2 in chromosome 2 tell us? Well, for one, it tells us it’s likely a fusion because this is a telomere specific pseudogene. Also, the exon on the far side of the fusion point used by only a fraction of recorded transcripts is nestled within telomere specific satellite DNA. Well-understood and observed mechanisms easily account for the percentage of transcripts that cross into the fusion point, so any objection of “How did that fraction get in the site if it wasn’t designed that way?” is null and void.

Overall, the very work pushed forward by Tomkins and other creationists involving the DDX11L2 does a lot more to support the fusion model and does not harm it in any way. The idea of a chromosomal fusion event in our species past is still on very solid ground. I’ll let David Levin sum it up. (2.)

In any event, what we see are two different telomere-specific signatures on either side of the fusion site. This region veritably screams “telomere”.

I rest my case.


Citations:

1. http://www.biomedcentral.com/1471-2164/10/250

2.http://sandwalk.blogspot.com/2015/06/creationists-discover-that-human-and.html